Categories
democrats Politics

Republicans Attacking Democratic Spending, But Who Has Spent The Most?

You’ve all heard the claims, that the problem in Washington is not a revenue problem but a spending problem. Republicans have successfully led many to believe that Democratic presidents have contributed the most to our national deficit. But there is something called the truth, and the truth cannot be denied especially when it’s backed up by statistics.

Here’s a look at the spending in this nation over the last 30+ years. Something Republicans refuse to comprehend.

Categories
Health Care ObamaCare Politics Repeal

Health Care Spending at Slowest Pace in More Than 50 Years

The New York Times is reporting that the growth of health spending has slowed substantially in the last few years, surprising experts and offering some fuel for optimism about the federal government’s long-term fiscal performance.

Much of the slowdown is because of the recession, and thus not unexpected, health experts say. But some of it seems to be attributable to changing behavior by consumers and providers of health care – meaning that the lower rates of growth might persist even as the economy picks up.

Because Medicare and Medicaid are two of the largest contributors to the country’s long-term debts, slower growth in health costs could reduce the pressure for enormous spending cuts or tax increases.

In 2009 and 2010, total nationwide health care spending grew less than 4 percent per year, the slowest annual pace in more than five decades, according to the latest numbers from the Centers for Medicaid and Medicare Services. After years of taking up a growing share of economic activity, health spending held steady in 2010, at 17.9 percent of the gross domestic product.

The growth rate mostly slowed as millions of Americans lost insurance coverage along with their jobs. Worried about job security, others may have feared taking time off work for doctor’s visits or surgical procedures, or skipped nonurgent care when money was tight.

Still, the slowdown was sharper than health economists expected, and a broad, bipartisan range of academics, hospital administrators and policy experts has started to wonder if what had seemed impossible might be happening – if doctors and patients have begun to change their behavior in ways that bend the so-called cost curve.

If so, it was happening just as the new health care law was coming into force, and before the Supreme Court could weigh in on it or the voters could pronounce their own verdict at the polls.

Source: The New York Times

Categories
Barack Obama George Bush Politics

Debunking The Fox And Limbaugh Lie Machine

George Bush

I like the way Dave Johnson started his article on this subject.

He gathered the following three charts from the  Budget of the United States Government: Historical Tables Fiscal Year 2012, and advised us that the next time “your right-wing brother-in-law” who “…is plugged into the FOX-Limbaugh Lie Machine, and keeps sending you emails about “Obama spending” and “Obama deficits” and how the “Stimulus” just made things worse…”,  these are the charts you should show him.

Keep your fingers crossed and hope for the best. Although you will be presenting that person with the facts, the FOX-Limbaugh Lie Machine is very effective. Most, subjected to their daily dose of lies, don’t even know they’re infected.

Here goes!

Chart 1 – Spending

  • Under George Bush, spending increased by 88%.
  • Under Barack Obama, spending increased by 7.2%. Yet, this President is being blamed by the right for massive spending.

Chart 2 – Deficit

  • On the left of this chart, we see Bush increases the deficit by $1.4 trillion. This was after taking office with a $128 billion surplus from his predecessor, Bill Clinton.
  • On the right of this chart, we see Barack Obama temporarily increasing the deficit, mainly because when he came into office, George Bush’s fiscal policies were still in effect. For the remaining years of Obama’s term/s, deficit projection is expected to be at reduced levels, as compared to that of Bush.

Chart 3 – The Stimulus

  • This one is so simple, even Fox dedicated viewers could see what’s happening. When George Bush left office, as shown in the red, his policies caused a consistent job loss in the private market every month. After Obama took office, and after signing the stimulus into law, the blue lines shows fewer and fewer monthly job loss, eventually resulting in job gains. And as the chart says, July marked the 17th consecutive month of private sector job growth under President Obama.

But then again, if your brother-in-law is already brainwashed by the FOX-Limbaugh Lie Machine, charts like this showing the truth are not what he’s looking for. For him, it may already be too late. But try anyway.

Categories
Barack Obama George Bush Politics

Bush Vs. Obama – Who Spent The Most

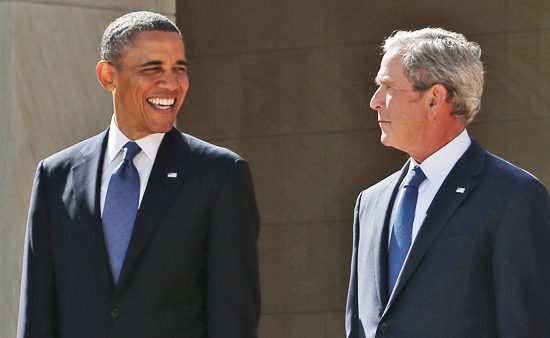
A new report from the New York Times attempts to answer the questions – how did our economy get to this point? And where did this massive deficit come from? The report took the spending habits of the last president, and compared them to those of President Obama, from his inauguration in 2009 and projected through 2017, and interestingly, despite what Republicans and Conservatives think, George Bush still out-spent Barack Obama by more than 2 to 1.

When President Clinton left office in 2001, George Bush inherited a surplus, one that was projected to be over a trillion dollars for the next decade if the Clinton policies remained in effect. The chart below, which took information from The Congressional Budget Office and The Center on Budget and Policy Priorities, tells the story of George Bush and his spending ways, and how he turned a surplus into a deficit beginning in 2002, and how that deficit grew each year until he left office in 2009.

  • The Bush wars in Afghanistan and Iraq, along with Defense – $1.5 Trillion added to the deficit.
  • The Bush Tax Cuts – $1.8 Trillion added to the deficit.
  • Non-Defense Discretionary spending under George Bush – $608 Billion added to the deficit.
  • Bush Tarp and other Bailouts – $224 Billion added to the deficit.
  • Bush’s Medicare Drug Policies – $180 Billion added to the deficit.
  • Bush’s Stimulus and other spending – $773 Billion added to the deficit.

All in all, George Bush took an actual surplus of $127 billion in 2001 and turned it into a deficit of $319 billion in 2005. His total in new spending equaled over $5 trillion. This figure dwarfs the $1.44 trillion in new spending President Obama is expected to make through two terms ending in 2017.
It should be noted that the biggest spending spree George Bush and the Republicans went on, according to these figures from the Congressional Budget Office, was the Bush Tax Cuts. The New York Times report puts it this way; “If all of them [Bush Tax Cuts] expired as scheduled at the end of 2012, future deficits would be cut by about half, to sustainable levels”.
Categories
Barack Obama Mitt Romney Politics Republican Party (United States) United States

Steven Colbert Disects Romney’s Peacetime Statement. Video

Mitt Romney recently made a statement that caused his opponents to question whether the Republican presidential wanna-be is ready for the demands of the office. Mr. Romney, questioned the spending of President Obama in an editorial he wrote for the Manchester Union Leader, saying “Barack Obama is facing a financial emergency…yet his approach has been to engage in one of the biggest peacetime spending binges in history.”

“Peacetime spending binges?” Who would have thought we were living in peaceful times? And this coming from the man Republicans want to take over the job as President Of The United States.

Steven Colbert gives his views on this. A must see…

Exit mobile version